
Technical Insight | Wind Data Availability Impacts Your ROI Estimation A Lot
After each wind measurement campaign for onshore or offshore sites, the resource assessment report is generally provided by a 3rd-party for the investors to make design decisions and estimations for the investment. The campaigns may face data availability issues during the typical one-year or two-year measurements regardless of whether anemometers and vanes are in use or the wind LiDARs are in use. The typical practices include the following ones:
1. Measure the significant data loss month(s) in the next year and interpolate the gap data.
2. Use nearby trusted reference data to interpolate the gap data.
3. Use model-based data to interpolate the gap data.
4. Use the measured data without other actions if the data availability is good.
However, all the methods cannot fully eliminate uncertainty because it's hard to prove how much the interpolated data's deviation is from the actual data. One common approach is to select the wind turbine and design the wind farm with higher uncertainty in consideration, but this will lead to higher investment and lower returns.
We analyzed one set of one-year measurement data of our BA-FLS-NX5 floating LiDAR system. The data itself is with a good availability at over 98%. We simulated different scenarios of data losses and found the data availability issue may bring significant wind speed deviations. Since wind energy has a cubic relationship ( P = 1/2ρAv3, where ρ = Air Density (kg/m3), A = Swept Area (m2), v = Wind Speed (m/s), P = Power (W) ) with the wind speed, the impact to yearly energy production will have much higher deviations in theory.
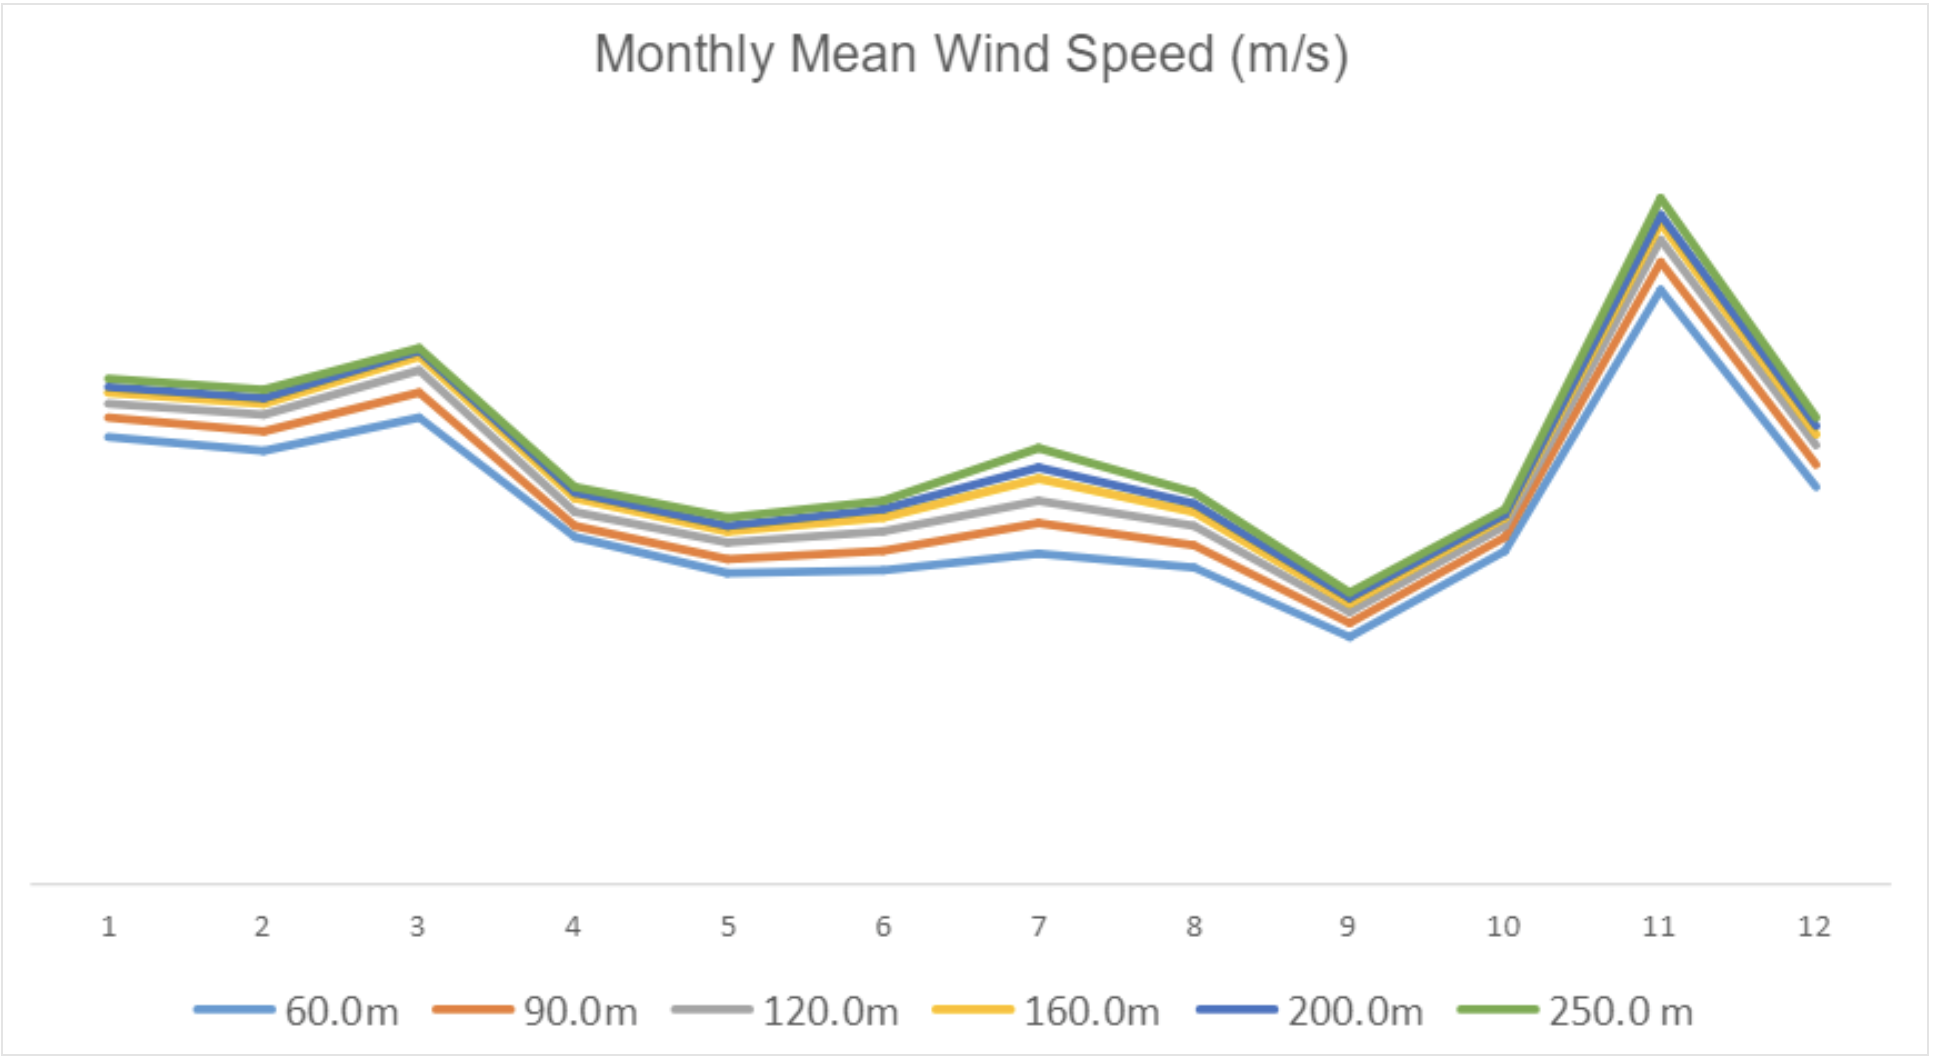
Figure 1: Average wind speed of the 12 months
Figure 1 shows the monthly wind speed average (we removed the Y-axis value as actual wind speed is confidential). The raw data availability from the FLS measurement is quite high and is listed in Table 1.

Table 1: Raw FLS data availability for each height
We choose Month-9 with the lowest wind speed and Month-11 with the highest wind speed to analyze the impact range of yearly mean wind speed and power by simulating data losses. The simulated cases and impacts are presented in Tables 2, 3, and 4.

Table 2: Data availability after simulated data removal for Month-9 or Month-11
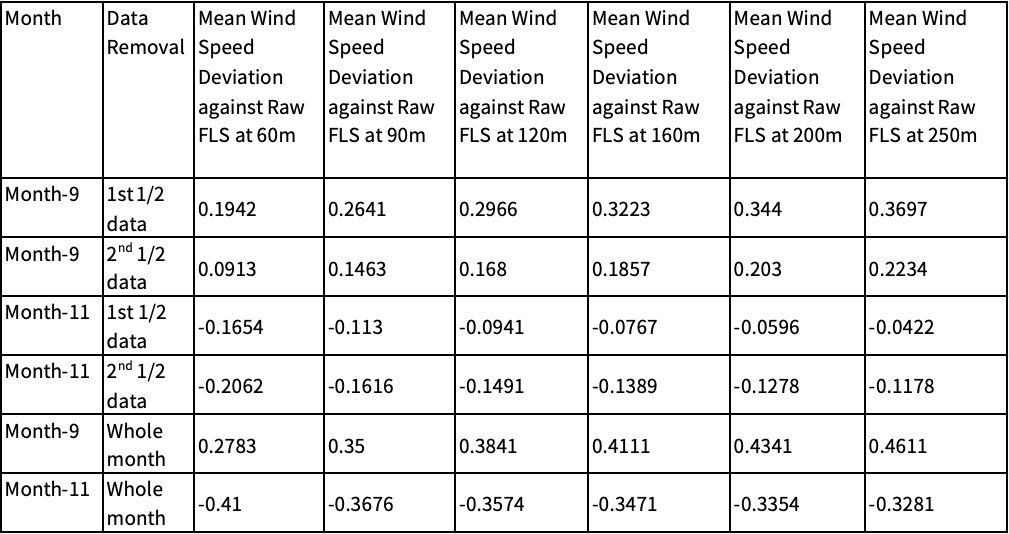
Table 3: Mean Wind Speed Deviation against Raw FLS after simulated data removal

Table 4: Power Deviation Ratio against Raw FLS after simulated data removal
With the simulation results of this data set, we can find that if the data loss is around 10%, the power estimation results in extremely high uncertainty, from -14.56% to +15.42% for various heights. If the data loss is around 5%, the power estimation also results in quite high uncertainty, from -7.51% to +12.25%.
This test is only for reference since each site may have different deviation dynamics and different methods may be applied to lower down the uncertainty. But we may conclude that wind data availability is vital to the certainty of investment. As a result of full redundancy and robust design, the BA-FLS-NX5 floating LiDAR system is proven with over 97% average data availability in recent years. We stand firm to ensure higher certainty of investment for our clients.